Does Open Data Reveal National Critical Infrastructures?
This blog post is based on the report “Open Data Analysis to Retrieve Sensitive Information Regarding National-Centric Critical Infrastructures” by Renato Fontana.
Democratization of Public Data
The ideas of Open Data comes from the concept that data should be freely available to use, reuse, and redistribute by anyone. An important motivation in making information available via the Open Data Initiative was the desire for openness and transparency of (local) government and private sectors. Besides openness and transparency, also economic value can be created by improvement of data quality through feedback on published data. Typically, most content available through Open Data repositories refers to government accountability, companies acceptance, financing statistics, national demographics, geographic information, health quality, crime rates, or infrastructure measurements.
The volume of data available in Open Data repositories supporting this democratization of information is growing exponentially as new datasets are made public. Meanwhile, organisations should be aware that data can contain classified information, i.e., information that should not be made publicly available. The explosive rate of publishing open data can exert the information classification process to the limit, and possibly increase the likelihood of disclosure of sensitive information.
The disclosure of a single dataset may not represent a security risk, but when compiled with further information, it can truly reveal particular areas of a national critical infrastructure. Visualisation techniques can be applied to identify patters and gain insights where a number of critical infrastructure sectors overlap.
This blog post shows that is possible to identify these specific areas by only taking into account the public nature of information contained in Open Data repositories.
Method and Approach
In this study, we focus on Open Data repositories in the Netherlands. After identifying the main sources of Open Data (see details in report), web crawlers and advanced search engines were used to retrieve all machine readable formats of data, e.g., .csv, .xls, .json. A data sanitation phase is necessary to remove all blank and unstructured entries from the obtained files.
After the data sanitation, some initial considerations can be made by observing the raw data in the files. For example, finding a common or primary identifier among datasets is an optimal approach to cross-reference information. In a next step, the datasets can be visualised in a layered manner, allowing for the identification of patterns (correlations) in the data by human cognitive perception. In visualisation analysis, this sense-making loop is a continuously interaction between using data to create hypothesis and visualisation to acquire insights.
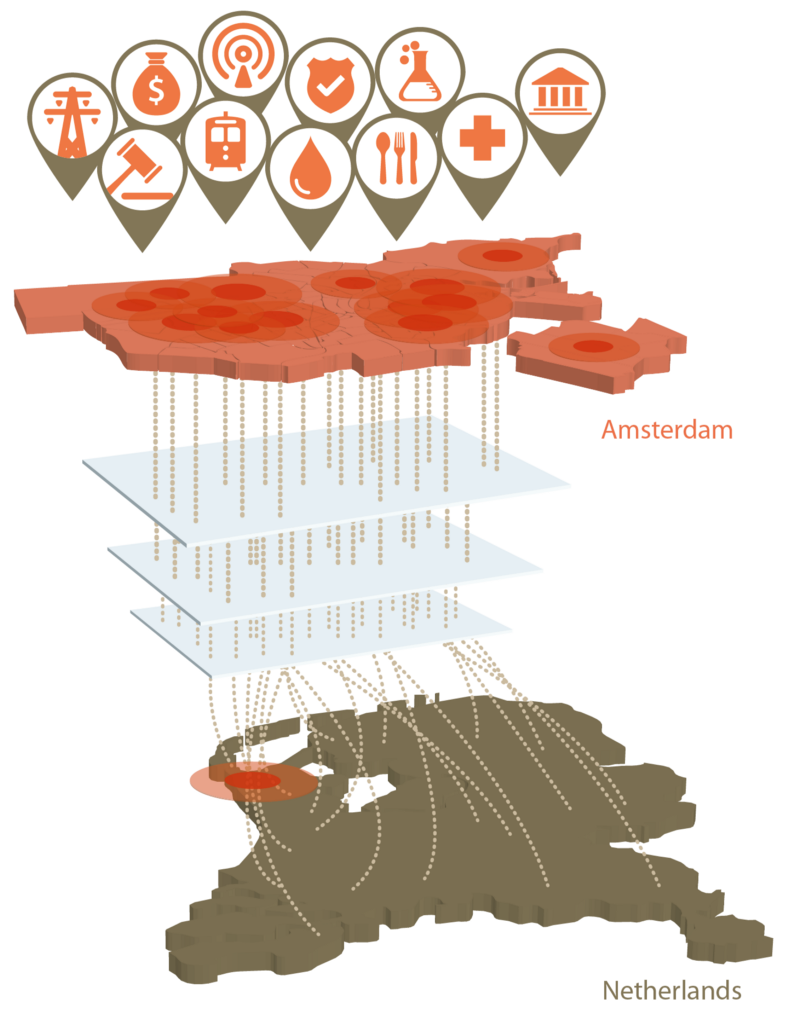
As the research was scoped to the Netherlands and Amsterdam, the proof of concept took into the account the government definition of “critical infrastructures”. Also, research was limited to datasets referring to energy resources and ICT. A visualization layer was created based on each dataset that could refer to a critical infrastructure.
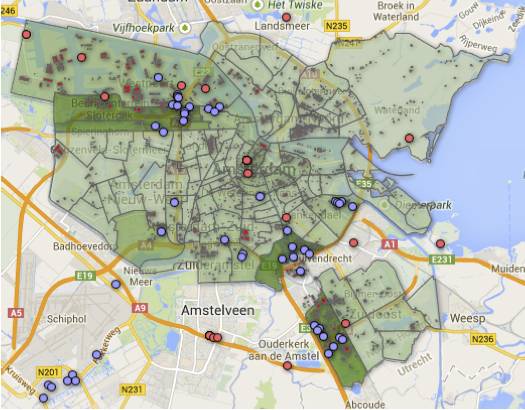
Visualisation of Data
From the different Open Data sets, a layered visualisation is generated and shown below. The figure provides sufficient insights to illustrate that most data centers in Amsterdam are geographically close to the main energy sources. It also suggests which power plants may behave as backup sources in case of service disruption. In the case of Hemweg power plant located in Westpoort, it is clear how critical this facility is by observing the output amount in megawatts being generated and the high-resource demanding infrastructures around it.

A few datasets contained fields with entry values flagged as “afgeschermd”, suggesting the existing concern in not revealing sensitive information. The desire to obfuscate some areas can be seen as an institutional interest in enforcing security measurements. Thus, that such information is sensitive and its disclosure can be considered as a security threat.
Conclusions and Considerations
Results and insights in this research are considered not trivial to be obtained. Even within a short time frame for analysis over a specific set of data, we were able to derive interesting conclusions regarding the national critical infrastructures. Conclusions of this nature can be something that governments and interested parties want to avoid to be easily obtained due to national security purposes.
The presented research confirms the possibility to derive conclusions from critical infrastructure regions based on public data. The approach involved the implementation of a feedback (sense-making) loop process and continuous visualization of data. This ongoing effort may create space to discuss in which extent this approach can be considered beneficial or dangerous. Such discussion must be left to an open debate, which must also consider the matter of Open Data and national security.
To open or not to open data?