NSD4 Performance Measurements

By Wouter Wijngaards
NSD 4 is currently in beta and we are expecting a release candidate soon. This is the first of a series of blog-posts in which we describe some findings that may help you to optimize your NSD4 installation. The article also serves as an explanation for differences that may show up in various benchmarks.
NSD4 Optimisation
The NSD4 code has been optimised: The latest beta(4.0.0b5) has a couple of optimizations (and beta bug fixes). We tested the results of our efforts on NLnet Labs’ DISTEL testlab and performed a number of speed measurements. Several other common open source nameservers are also tested.
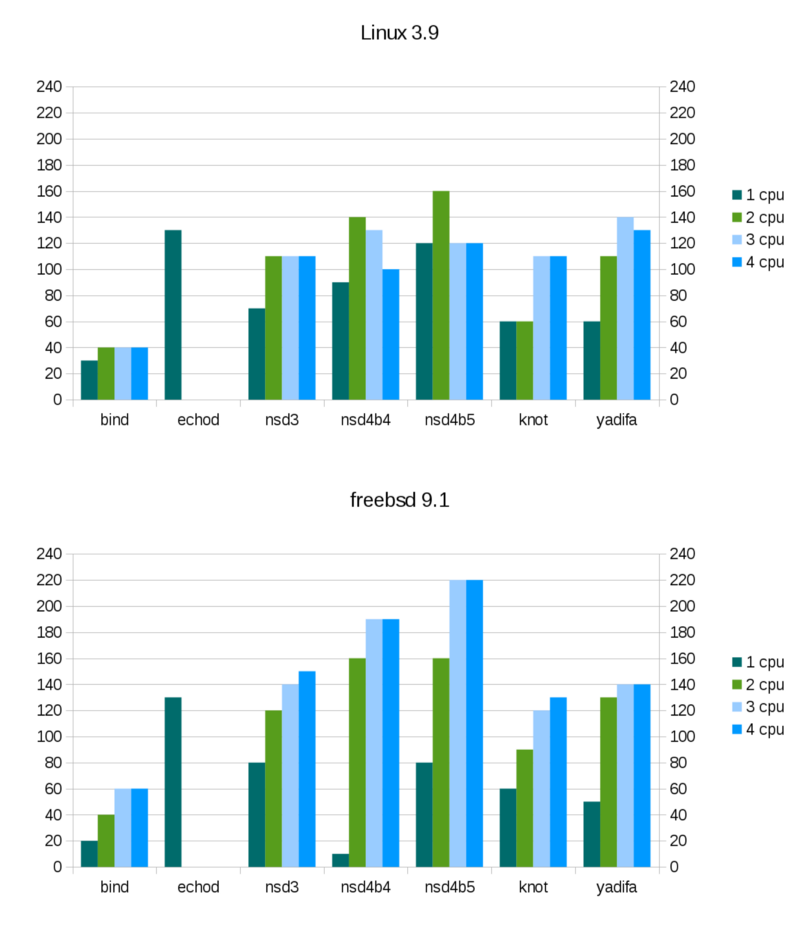
A quick view on the results, the figures below show the query load in kqps (1000 of queries per second) for which the different nameserver implementations still manage to answer 100% of all queries. Higher queries rates lead to packets being dropped. Some servers had 99.9% responses on lower qps but then recovered to 100% queries answered at higher query rate. This may be the result of test measurement instability and was ignored.
Similar results as reported by the Knot and Yadifa teams are found, but delving deeper into the performance measurements reveals some subtleties in behavior that bias the results. Knot and Yadifa show very similar or better performance than NSD when they are configured on Linux based servers to use exactly 4 out of 4 cpus. Of course, this is strange and we searched further to look at what caused these outcomes, and it turns out to be related to the number of threads (and processes) and the choice of operating system.
NSD3 has about the same performance as Knot (on Linux). Yadifa is a little faster than Knot. NSD4 is faster than NSD3, and with optimizations in implemented in beta5 even more so.
Knot and Yadifa use a threaded model, where they have threads in one single process that service the DNS requests. Bind can also be compiled with thread support, which was done here for comparison. It seems that Bind can scale up its performance in both Linux and FreeBSD with more threads, up to 3x more performance. NSD is different to the other implementations in that it uses processes that service the DNS requests instead of threads. This is where operating systems differences start to matter. Operating systems differ in their threads and processes implementations and in their implementations of the network code.
FreeBSD can increase its packet output when the number of threads is increased, and it can also increase its packet output when the number of processes is increased. However, Linux treats threads and processes very differently, and in both cases, using a number of workers equal to the number of CPU cores is not optimal. The ksoftirqd Linux irq (interrupt) handler uses up the remainder of the four CPU cores when the server uses less than all four cores, likely the implementation of irq handling is a source of measured differences. Interrupts are caused by incoming packets and handling the interrupts from the network card under high load needs a lot of processing power. FreeBSD can push out more packets on the same hardware configuration, with the same software.
The optimal choice of the number of CPU cores to devote to DNS processing depends on the software. On FreeBSD, use as many cores as installed in the system. On Linux, use less than the total number of cores, 2 out of 4 cores for NSD. And 3 out of 4 cores for Yadifa. On Linux, Bind and Knot benefit from using 4 out of 4 cores.
Our Measurements: DISTEL Test Setup
Measurements were carried out using a modified DISTEL testlab setup. The configuration of the DISTEL testlab is with a number of (mostly identical) machines. There is a Player, a Server and a number of replay machines.
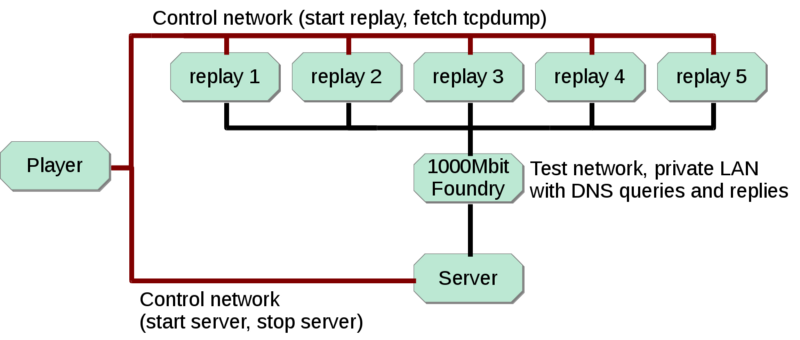
The player controls the action, this is scripted. The control is performed over ssh over the control network. The player starts the server software on the server machine, listening on the private LAN. A set of queries is replayed from the replay machines. The resulting replies are captured with tcpdump. Because the PowerEdge 1950 on the server is capable of replying with up to 140.000–160.000 qps on Linux and 220.000 qps on FreeBSD, multiple replay machines are necessary to send and record traffic to the server. Each replay machine sends 1/5 of the query traffic. This adds up to the total qps for the server machine. Test code on the replay machines measures if the actual sent packets correspond with the intended query rate (with timers). The test is run for a fixed time period, so that faster query rates still take the same time period. The maximum qps for this setup is around 430–440 kqps, but the measurements are up to 400kqps. Instability of the outcome seems to increase a little for the higher speeds (esp. for speeds above 350k which cause trouble for some (weaker) replay machines). In any case, the instability is several percent of the response rate percentage.
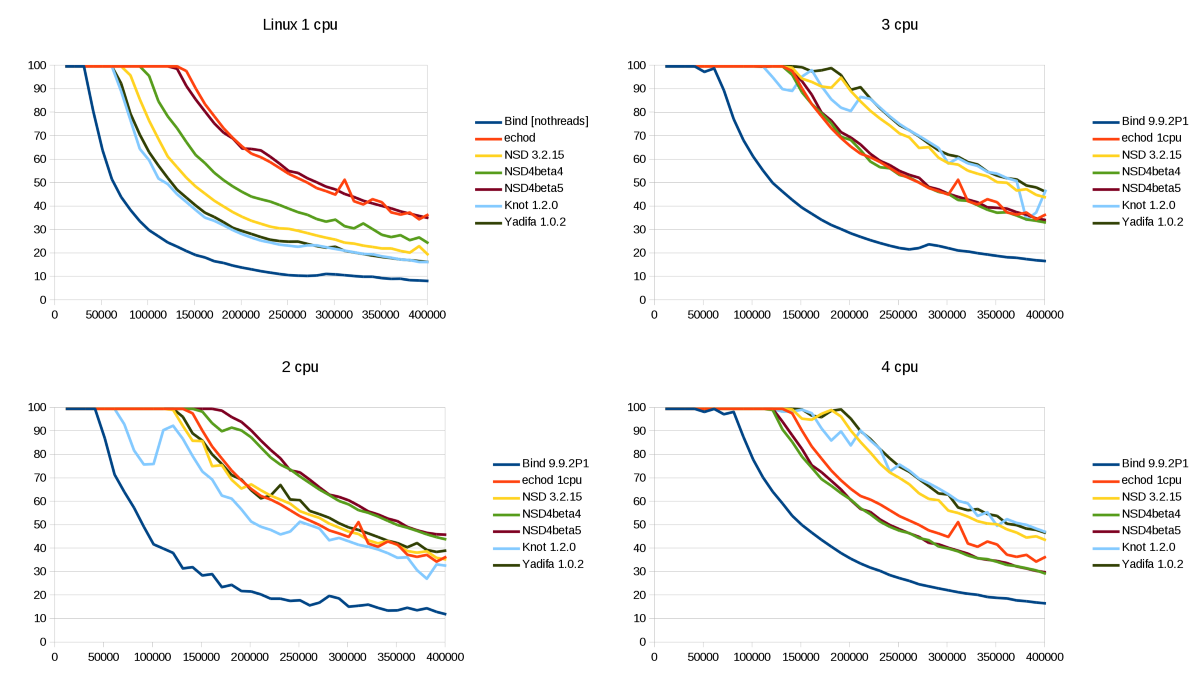
The detailed graphs for Linux 3.9:
The detailed graphs for FreeBSD 9.1:
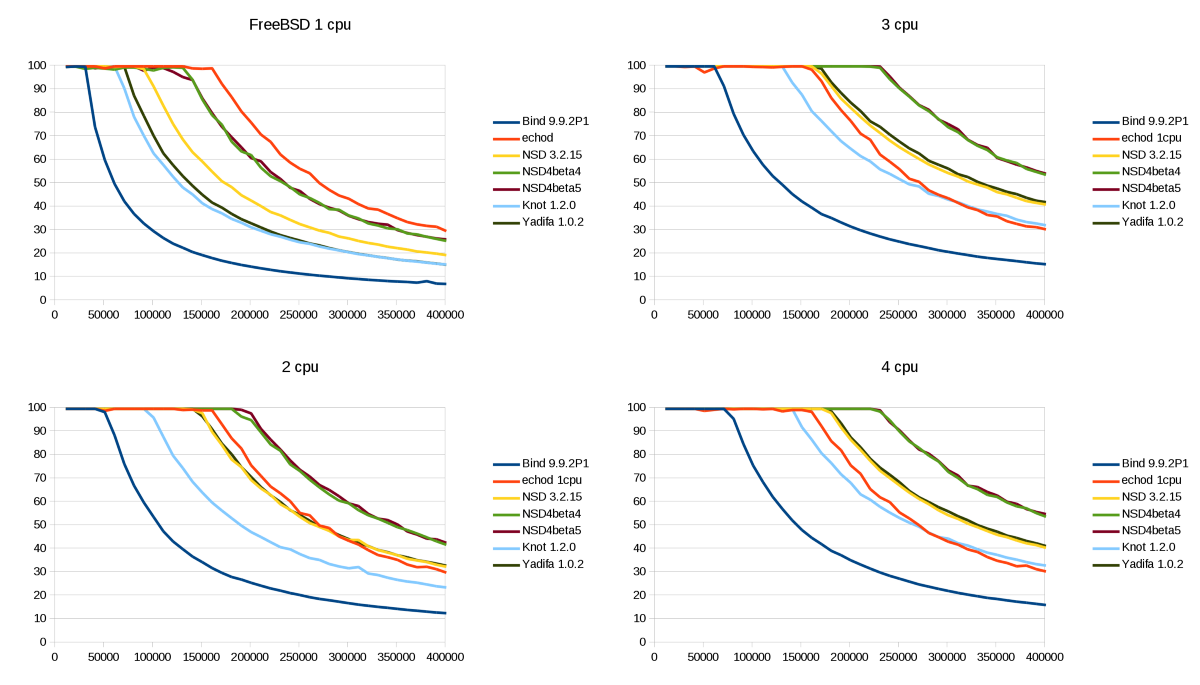
The bar graphs at the beginning of this post are based on these detailed plots, analyzing where 100% responses occur.
The software tested is BIND 9.9.2-P1, NSD 3.2.15, NSD 4.0.0b4, NSD 4.0.0b5, Knot-1.2.0 and Yadifa 1.0.2–2337. The server hardware is a Dell PowerEdge 1950, 2 x 64-bit Intel Xeon CPU 2.0 GHz, thus 4 cores in total, 4 MB cache, 1333 MHz FSB. The Ethernet is the on-board Broadcom NetXtreme II BCM5708 1000Base-T interface. Settings are left at their defaults, if possible. The zone that is loaded is an artificial (test) root zone that contains around 500 delegations, it is not signed with DNSSEC. This zone is an old zone, created before the root was signed (and it is the same zone as previously used for measurements). The order of the queries is random and there are no queries that result in nxdomains.
Future work
In preparation for the release of NSD4 we are measuring the behavior for larger zones in terms of performance and memory usage.